![]()
![]()
![]()
![]()
![]()
![]()
![]()
![]()
![]()
![]()
![]()
![]()
![]()
![]()
![]()
![]()
The PC-8 Computer
Written March 9, 2004
As the graphics operator for the Pirates Television Network in the late 1980s, I wanted to be able to prepare several bar graphs before each telecast.
|
To:
Pirates Television Network Announcers On three or four baseball telecasts late last season, we displayed team-comparison stats with the help of animated bar graphs like the one below. We feel that this helps the viewers see what the stats mean, so we plan to use these bar graphs on a regular basis this year.
To avoid having any questions arise on the air, here are a few notes about these stats. The numbers are based on the stats coming into the game. Sometimes we might be able to update them to include what the teams have done so far in tonight's game, but if we do so, we'll tell you "this is updated" through your headset. With two exceptions, the #1 ranking goes to the team that has the largest number in the league in the given category, regardless of whether having a large number is good or bad. For example, the team with the most errors is ranked #1 in errors. The two exceptions are golf scores and team ERA. In those two categories only, the team with the smallest number is ranked #1. One type of team comparison shows won-lost record under special circumstances. For example, against lefthanded starters the average N.L. team has a 5-6 record, while the Padres are 4-8 (ranked #12) and the Bucs are 5-4 (ranked #2). For your information, the rankings and the length of the bars are based on the won-lost percentages, which are .454, .333, and .556 in this example. But we don't show those percentages on the screen; there are enough numbers already with the records themselves. |

The numbers were readily available from the printed league stats, but how long should the bars be?
The longest bar that would fit on the TV screen was about 32 characters long. To make that represent 141 doubles would require one character for 4.4 doubles. So the other two bars, for 130 doubles and 124 doubles, should be 30 and 28 characters long respectively, like this:
•••••••••••••••••••••••••••••• 130
•••••••••••••••••••••••••••••••• 141
••••••••••••••••••••••••••••
124
But those three bars are almost the same length. The graph would reveal that there really wasn't that much difference among the numbers, while as broadcasters we want to make a story out of the stats. We want to make it seem as though any small differences are significant. We'd like to ignore the left half of the bars and magnify the right half.
What would it be like if we exaggerated the difference by making the longest bar 32 characters but the shortest just 8 characters, regardless of the numbers they represent? The middle bar could be made proportional to the other two. The result would look like this:
•••••••••••••••• 130
•••••••••••••••••••••••••••••••• 141
•••••••• 124
That gives us a definite and obvious difference, but it's perhaps too exaggerated. I decided that the best compromise would to average the results of these two methods of calculation.
A fair amount of number-crunching would be required to do this, and I didn't have a lot of spare time on the day of a game. The problem called for a computer!
I considered bringing my home computer along, a laptop-sized Tandy Model 100, but I discovered that there was a smaller, more portable device available — the Tandy PC-8 Pocket Computer.
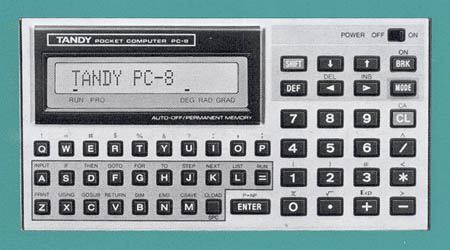
Its instruction manual called it "one of the most sophisticated hand-held computers in the world today." It boasted a four-bit processor and a whopping two kilobytes of RAM. On February 6, 1988, in preparation for the upcoming baseball season, I purchased one for $59.95 at the Radio Shack at the Monroeville Mall.
Later that year I spent an equal amount for a printer/cassette interface, as shown below.

The computer itself — less than 5½" long, less than half an inch thick, weighing only three ounces — could be tucked into a pocket of my briefcase and sit in a blank area on top of my Chyron keyboard. (On the display is a boxing timer. More about that later. I've used the PC-8 as a backup on boxing telecasts as recently as 2003!)
When I wasn't on the road, the black accessory cradle offered AC power, a thermal adding-machine printer, and an interface for storing programs on an audio cassette recorder.
The PC-8 is completely obsolete now, of course, compared to Palm Pilots and such. But it could be programmed in BASIC, and I wrote programs to do what I wanted.
|
To:
Any Substitute Chyron Operators
We present comparative team statistics using bar graphs, so that the viewers can more easily grasp what the stats are telling us. A typical lower-third panel looks like this:
Making this autodisplay is fairly tricky. Here's how it's done.
Arithmetic Your raw data comes from the MLB/IBM Notes, the league statistics that are available a few hours before game time. For each category (doubles in our example), those notes list the totals for each of the twelve teams in the National League. But you need to figure the league average and the rankings of the two teams playing on tonight's telecast. You also need the proper lengths for the three bars on the graph. Here's how I determine appropriate lengths. Let G be the biggest of the three numbers (141 in our example). The bar corresponding to G is 32 characters long, because that's the longest that will comfortably fit on the screen. Let E be the smallest of the three numbers (or 124). The bar corresponding to E is always between 4 and 20 characters long, the actual formula being 16E/G + 4. In our example, that formula works out to 18 characters. Let N be the middle number, or 130. The bar of middle length is given by the formula 16N/G + 12(N-E)/(G-E) + 4. In our example, that becomes 23.
The Computer To make these computations much easier, we use a checkbook-size computer, a Tandy PC-8. Here's how to run the program. Turn on the power switch. Press DEF and N. The computer asks for VISITORS. If the visitors have 141 doubles, press 1, 4, 1, and ENTER. The computer asks for HOMETEAM. Press 1, 2, 4, and ENTER. Now the computer asks for numbers for the other ten teams in the league. Enter these. Normally these numbers are entered without decimal points. If the category is batting averages, enter 265, not .265, because the latter would confuse the computer. But you can use a decimal point for a special purpose: categorical won-lost records, for example on grass fields or in extra innings. In that case, enter each record as if wins were dollars and losses were cents. A 7-5 record would be entered as 7.05, for example. After all twelve numbers have been entered, the computer will give you three sets of answers like this:
The numbers between the decimal points are the lengths of the bars. The numbers on the right go at the end of the bars. (Of course, if you've been entering "dollars and cents," the numbers on the right will be something like 8.08, which you would type as 8-8 on the screen). And the rankings are indicated by # signs.
The Frame Read 2294 from the message disk. Retype "BUCS" and "PHILS" as necessary. Change the palette as necessary; yellow should be the visitors' team color (normally 706 for the Pirates), and red should be the home team's color. Re-record at 2294.
The Autodisplay Call up the existing autodisplay from 2270. [An autodisplay is a programmable routine used by the Chyron character generator to play back "keystrokes" very rapidly for animation purposes. In this case, a bar on the screen is printed out by typing as many as 32 characters, each character being the letter I, shifted to the left so that it's touching its neighbor.] Now for each set of data, delete parts of the autodisplay and replace them with new numbers. The parts to be deleted and replaced are underlined in the listing below. When you're finished, check the operation of the autodisplay. Then record it at an address between 2270 and 2292. (It's so long that it will take two addresses.)
|
By the next season, I had taught the PC-8 some new tricks. Because of its very limited memory — only 1,278 bytes for programs and data — I had to delete the feature where it could rank teams' records like 7-5 and 8-8 by calculating the winning percentage. However, I managed to squeeze in all of the following routines.
|
Date:
February, 1989
Career Earned Run Average Press DEF = to begin. Computer asks twice for IP.X (where X is thirds of an inning) and ER. [One set of numbers refers to the pitcher's career coming into this season, as listed in the press guide; the other set refers to this season.] It adds the pairs of numbers and gives you the composite ERA.
600:"=":
CLEAR
Updating Batting Average DEF B to begin. The display reads 910. 0.0. 000. where 910 is a Chyron address to identify the player, 0.0. means that he's 0 for 0 in tonight's game, and the last number is his updated season batting average. Use the number keys to give commands as follows.
After you've called 8 to enter season at-bats and hits, the display will show the batting average. If the player is replaced during the game, call 8 again [to enter the new player's at-bats and hits]. When you're not using the computer, turn off the power. When you turn the power back on, use DEF Z (instead of DEF B) to resume without erasing your old data.
700:"B":
CLEAR :Z=1
National League Rankings DEF N to begin. Enter 12 numbers (without decimal points). Then the computer will give you three answers of the form VIS #3.24.82, where the number between the periods is the length of the bar in the bar graph and the other two numbers should appear before and after the bar, respectively. Press ENTER to see the next answer, and ENTER again to restart the program.
900:"N":
CLEAR |
I soon found another use for the PC-8 besides baseball.
There are no scoreboards at professional boxing matches. The sport has stubbornly remained in the 19th century, announcing each round by carrying a numbered card around the ring while refusing to let the fans see the round-by-round judges' scores — or a clock.
It's not as though the timing is complicated. Unless the referee calls a time-out for an injury or something, the clock runs continuously: three minutes for Round 1, a one-minute break, three minutes for Round 2, another one-minute break, and so on.
When a bout is televised, we in the television graphics department have to generate our own clock and superimpose it on the screen. We start it from 3:00 when the bell rings to begin a round, then count down towards zero, when hopefully the bell will ring again. (Because there's some uncertainty about all this, we remove our unofficial clock from the screen with five seconds left. If it shows "0:00" at some time other than the end of the round, conspiracy-minded viewers might think that the ringside timekeeper has cheated by sounding the bell early or late. Or worse, they might think that the TV crew doesn't know how to keep time.)
|
|
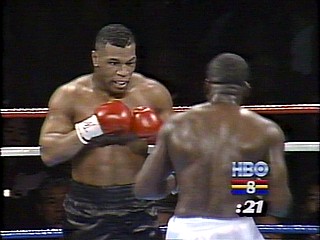
The PC-8 and I flew to Tokyo in February, 1990, to work the HBO telecast of Mike Tyson's upset loss to Buster Douglas. |
Typically, my graphics coordinator starts and stops a stopwatch. So does someone at ringside. They tell me when to start and stop the clock on the screen.
But I want to have my own independent time indication, in case my colleagues get distracted. And a simple stopwatch isn't really good enough. It can't remind me which round we're in, nor can it warn me how soon the next round will start.
I solved all these problems in 1988 by writing another BASIC program for the handy PC-8, turning it into a "smart" customized stopwatch.

Beginning with 3:00 ROUND 1, it waits for my keystroke. When the first bell rings, I hit ENTER, and the PC-8 starts counting down. After 0:00 ROUND 1 it keeps on going; the next second is 3:59 ROUND 2, and it counts down the minute intermission until 3:00 ROUND 2 when the bell should signal the resumption of boxing.
The PC-8 will keep going like this all night with no further intervention from me. However, its time may need to be corrected occasionally, and there are various buttons for that purpose. The one that I use most often is B, for bell, which reduces the seconds to zero and holds them there until the bell rings and I release the button.
|
October
21, 1988
100:"A" |
I loved the fact that I could customize this little device to behave in a special way that suited my purposes exactly. And that, in fact, is the essence of a programmable computer.
|
|
|
